Estimating trade in digital products
We construct a dataset of trade in digital products by combining ground truth data on the consumption of digital products for 60 countries with corporate revenue data for over 2500 digital firms (see Methods).
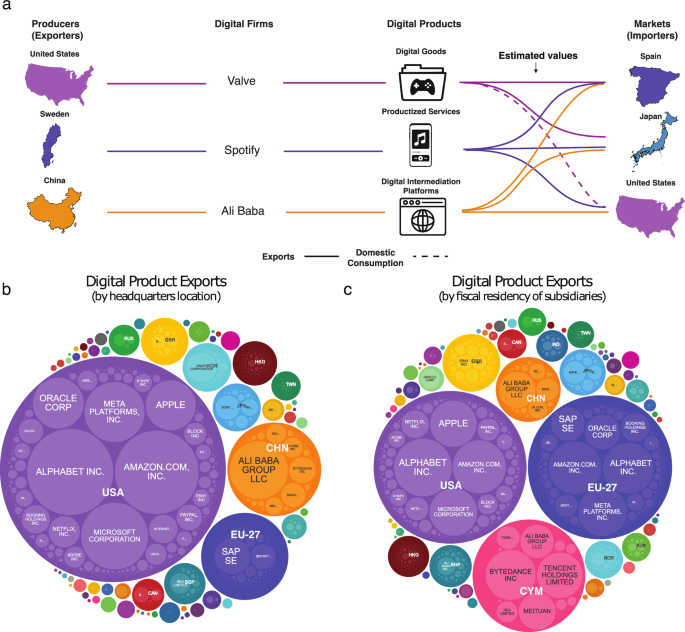
Figure 2 presents a schematic of our procedure. We use machine learning and optimal transport techniques to extrapolate this data to a total of 189 countries and 31 sectors (see Supplementary Table 2 for the countries and sectors covered in our dataset).
a We estimate bilateral trade in digital products (in USD) for 2,502 firms (belonging to 187 parent companies) and 13,013 important app developers starting from data on their revenue in each digital sector (icons from Envato Elements). We then use a gradient-boosted regression tree to estimate missing digital product consumption links and use optimal transport to assign consumption to firm revenues. b Firm level exports when all revenues are assigned to the headquarters location of the company. c Firm level exports when the revenues are assigned to the fiscal residence of subsidiaries.
We focus on companies involved in digital goods, productized services, and intermediation (e.g. marketplace platforms). Digital goods, such as video games and software, include products in a digital format with a marginal cost of production that is negligible or close to zero (e.g., eBooks, Software). Productized services, such as cloud computing and video streaming, leverage digital means to automate (almost always fully) the provision of a service. This makes the economics of productized services similar to those of manufacturing (low marginal cost for each unit and high fixed cost to initiate production). Finally, we consider also fees collected by intermediation platforms, whether these are involved in the purchase of a physically delivered service (e.g. lodging) or of a digital good or service (e.g. a mobile phone app).
We begin by selecting the largest internet companies (these are firms that do the majority of their business online and have revenues of USD 1 B or more) and manually identifying their subsidiaries from publicly available online sources (e.g., financial statements). Next, we use the Orbis database to gather revenue data (in USD). Orbis is one of the largest databases on firm level data with information on 400+ million firms across the globe50,51. For missing entries, we consult Statista52, a reliable secondary source for firm revenues. If revenues are still unavailable, we manually collect data from other publicly accessible web sources. We then decompose corporate revenues by digital product sectors using Statista’s Digital & Technology Market definitions as a baseline classification. This approach enables us to distinguish 29 digital sectors within the revenue structures of the firms in our dataset.
We then combine the revenue data with country consumption patterns (in USD) from a mobile market intelligence company tracking the consumption of all applications and games downloaded from the Apple’s App Store and Google’s Play Store for 60 countries (these are two additional digital sectors included in Statista’s classification, see Supplementary Table 2 for the countries with available data). We merge these datasets by connecting each firm’s sector to its country of origin and to the countries where consumption took place. In Supplementary Note 2 we provide the summary statistics of these data.
In total, we have 31 digital sectors. This enumeration, however, is not exhaustive; and certain digital products, like AI chatbots, are not captured in our analysis.
We use a gradient-boosted regression tree, a flexible supervised machine learning method, to extend the consumption data to an additional set of 129 countries (for a total of 189) and the 29 digital sectors discovered in the firm revenue data. Our model predicts the yearly consumption of digital products within the same sector that belongs to the same parent company for each country. For instance, it estimates the combined consumption in Chile of the cloud computing activities owned by a certain parent company and all of its subsidiaries in 2021. The model’s features are motivated by gravity models of trade53,54 and include parent-category-level variables, such as the total revenues of the parent company in the digital category (across all countries), and the total world consumption of the digital sector (e.g., all app revenues or all games revenues across all countries, see Methods and Supplementary Note 3.1.). We also include features that describe the relationship between the country where the headquarters of the company is located and the country where the product was consumed, such as shared language, borders, common colonizers, the geographic distance between these countries, their respective size in terms of GDP, and their ICT capacities. We cross-validate our model by using a group-K-fold approach, where we leave 20% (i.e., 5-fold) of the firm-category pairs as a test set, and train the model on the other firm-category pairs. We find that our model has a mean-squared error (MSE) of 23.14, and improves upon a baseline linear regression model (which has a MSE of 24.44). Also, for some of the parent companies included in our analysis we were able to extract the regional consumption from their annual reports (e.g., the total consumption of a multinational company in North America). We used this data to conduct an independent test where we compared the regional shares for the firms with available data with the ones predicted by our model, finding that our model has an MSE of 0.048 (the linear model has a MSE of 0.126, see Supplementary Note 3.2.).
We harmonize the resulting predictions by ensuring that aggregates match their input variables, and by normalizing them to be in accordance with known regional consumption shares. Namely, the cloud computing revenues of a multinational firm across all geographies must equal the total reported cloud computing revenue of that company. Moreover, we normalize our values to match the observed regional consumption shares by assuming that they are the same across different categories (e.g., a multinational firm’s revenue share in cloud computing and in digital advertising is the same as the aggregate share).
We allocate the consumption of a firm’s digital products to a country of origin using an optimal transport procedure55,56. This method assigns consumption to the revenues of the geographically closest subsidiary, without exceeding the subsidiary’s revenue. For instance, the combined consumption of all cloud computing activities of a multinational firm in Sweden is first assigned to the cloud revenues of that firm’s subsidiaries operating in that sector in Sweden. If these revenues exceed the total consumption of the firm’s cloud computing brands in Sweden, then the excess volume is assigned to the geographically closest subsidiary with unallocated revenues. In most cases, we lack information about the revenue share by sector of subsidiaries (we know only those of the parent company) and assume them to be the same as those of the parent company (proportional allocation). In other cases, we are able to manually extract the revenue structure.
We resort to optimal transport because we do not have information about transactions between parent companies and their subsidiaries or a rule guiding how these transactions take place. Transport methods allocate revenues to consumption by minimizing the distance between export origin and consumption. This leads to conservative estimates prioritizing the allocation of revenues to domestic consumption. To reduce the potential limitation of this assumption, we associate our estimates with upper and lower bounds generated by calculating 95% confidence intervals based on a linear regression that predicts the yearly exports of a firm-category pair and as independent variables uses the revenues of the firm in that category, country origin, and country destination fixed effects.
The international trade of firms operating all the digital sectors covered in our dataset is reported as trade in digitally deliverable services in the Extended Balance of Payments Classification (EBOPS, though there is no one-to-one mapping between the categories, see Supplementary Table 1). Also, the digital products included in our dataset are included in the International Standard Industrial Classification (ISIC) of All Economic Activities (Supplementary Table 1 maps our digital categories into the ISIC classification). Crucially, however, neither the Balance of Payments nor the ISIC distinguish between digital delivery and physical delivery channels.
Our resulting dataset consists of bilateral digital trade estimates for 15,515 firms, 189 countries, and 31 digital product sectors. This dataset, however, does not come free of limitations.
First, the reliance on consumption data primarily from apps and games for forecasting patterns in 29 additional sectors may lead to distortions. This is because the consumption characteristics of these sectors could differ from those observed in app and mobile games data. Furthermore, our assumption that the international trade patterns of digital products align with geographical proximity, as used in our optimal transport allocation, might not always hold true. While this assumption aligns with standard gravity laws of international trade53, the minimal physical constraints in digitally delivered trade might break this law.
Another key problem is the assignment of corporate revenues to countries, since digital firms sometimes take legal residence in economies with favorable tax regimes (e.g. Cayman Islands, Luxembourg)57,58,59,60. In our paper we provide estimates based on two assignment criteria: headquarters location (Fig. 2 b), and the fiscal residence of subsidiaries (Fig. 2 c). Estimates based on subsidiaries may be relevant to those interested in a fiscal view of the data, and unless otherwise noted, are the estimates used in the figures of the main text. In Supplementary Note 4 we also provide estimates assigning all revenues to a company’s headquarter, which may be better for those interested in the geography of digital production61 and those interested in GATS Mode 3 trade. Nevertheless, neither of these assignment criteria are optimal, since not all subsidiaries are legal entities created for tax purposes, and not all product design and development take place in a company’s headquarters.
Finally, our estimates are likely to be a lower bound for global trade in digital products because of two reasons. First, our data is based on a limited universe of firms, which is biased towards larger companies (revenues of USD 1B or more). Second, we assign trade to revenues of parents and subsidiaries conservatively, by counting as trade only the digital product consumption that cannot be accounted for by local consumption.
The growth, geography, and concentration of trade in digital products
We begin by comparing our estimates for trade in digital products with (i) trade in digitally delivered services (DDS) that include our digital sectors plus others (using WTO/UNCTAD data53), (ii) trade in services (which should also include our digital sectors), and (iii) trade in physical goods (see Methods for the data used for these comparisons). This helps validate and put in context the estimates we use to understand the growth, geography, and concentration of trade in digital products.
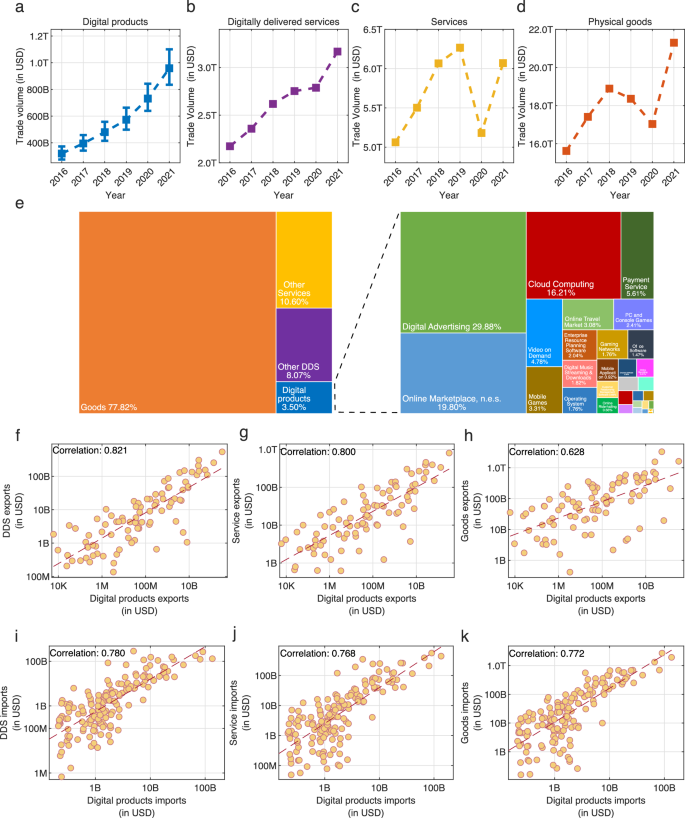
Figure 3a–d compares the aggregate dynamics of trade in physical goods, services, DDS, and digital products between 2016 and 2021. We find that trade in digital products has been increasing rapidly, and that it is comparable to estimates for the dynamics of DDS4. Namely, during these years, trade in digital products grew at an annualized growth rate of 24.5% (Fig. 3a), from 320 billion USD in 2016 (95% c.i. lower bound: 275 B, 95% c.i. upper bound: 373 B) to 958 billion USD in 2021 (95% c.i. lower bound: 835 B, 95% c.i. upper bound: 1.10 T). Similarly, trade in DDS grew at an annualized rate of 8% (Fig. 3b), suggesting that digital products play an increasing role in digitally delivered trade. The observed differences between DDS and digital products trade could be a result of the growing productivity of digital products, but also a consequence of the fact that our data is based on the top-performing firms, which are known to experience larger growth rates62. In contrast, services (Fig. 3c) and physical goods trade (Fig. 3d) grew moderately, with annualized growth rates of 3.7% and 6.3%. This growth gap accelerated in 2020 during the COVID-19 pandemic, when trade experienced a downturn (trade in physical goods declined by 7%, whereas trade in services declined by 17%), but trade in digital products grew rapidly, year-on-year at a rate of 28% (in the same year trade in DDS grew by only 1%).
a Estimated global trade in digital products in USD (this paper). The error bars show the 95% confidence intervals. b Estimated global trade in digitally delivered services in USD (UNCTAD). c Global trade in services in USD (UNCTAD) d Global trade in physical goods in USD. e Estimated composition of trade in digital products compared to services and goods trade in 2021. f–h Scatter charts comparing countries’ exports in 2021 of digital products to the exports in digitally delivered services (f), services (g), and goods (h) networks. i–k Same as f–h, just for imports. Figures f–h use data only for countries with non-zero digital product exports and the presented correlation is between the log values.
For 2021, we estimate trade in digital products to represent around 3.5% of world trade in goods and services (Fig. 3e), making it an area of increasing economic importance. If trade in digital products were to continue to grow at the same annualized rate experienced between 2016 and 2021, we would expect trade in digital products to reach about 15% of global trade by 2030. Figure 3e also shows the estimated composition of trade in digital products compared to trade in services and in physical goods. Trade in digital products is explained mostly by trade in cloud computing, online marketplaces, n.e.s., and digital advertising, which amount to around 65% of all estimated digital trade (see Supplementary Note 5 for the structure of trade in digital products over the years).
Figure 3f–m compare our estimates of digital product trade with exports (Fig. 2f–h) and imports (Fig. 2i–k) of DDS, services, and physical goods. We observe that the exports of digital products are highly correlated with trade in DDS (Fig. 3f), and that this correlation decreases as we move towards services (Fig. 3g) and physical goods (Fig. 3h). We also observe that imports of digital products are highly correlated with DDS (Fig. 3 i), however, in this case the correlation with services (Fig. 3j) and physical goods (Fig. 3k) does not decrease substantially.
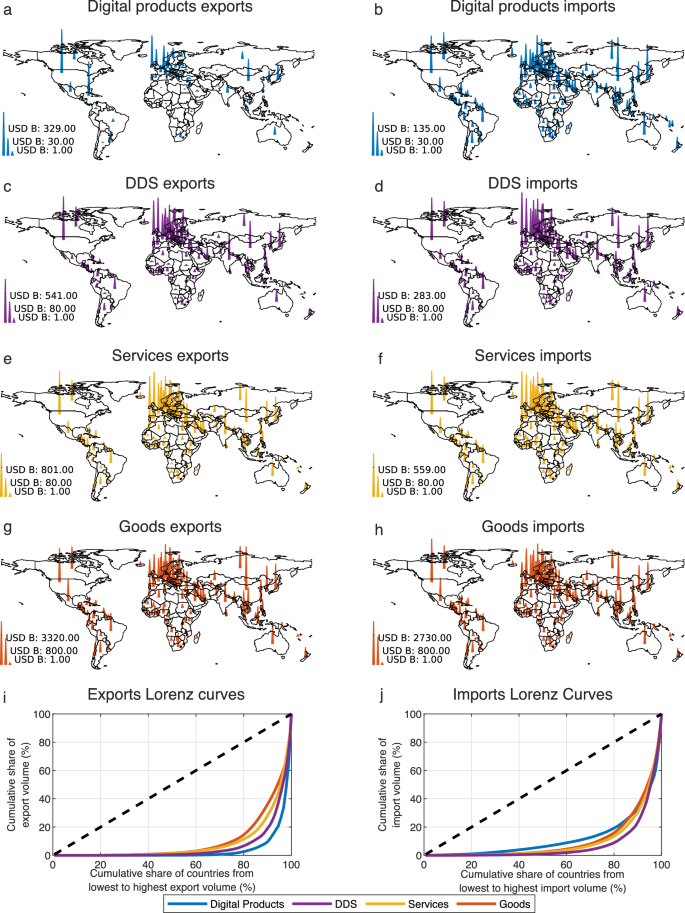
Figure 4 compares the spatial concentration of different forms of trade in 2021 using spike maps (Fig. 4a–h) and Lorenz curves (Fig. 4i, j) of digital products, DDS, services, and physical goods exports and imports. We find that 80% of trade in digital products originates in the top 3% of countries, whereas 80% of digital product imports go to less than 20% percent of countries. Digital product exports (Fig. 4a) are more spatially concentrated than DDS exports (Fig. 4c)49, service exports (Fig. 4e), and physical exports (Fig. 4g). Digital product exports originate primarily in the United States, but also in, small countries, such as Ireland, Luxembourg, and the Cayman Islands, when we use the assignment rule based on subsidiaries (which favors tax heavens). Digital product imports, however, (Fig. 4b), are not as similar to DDS (Fig. 4d) and service imports (Fig. 4f). Instead, they appear to be less concentrated, with levels of concentration comparable to physical imports (Fig. 4h), suggesting that they are driven by demand factors instead of supply constraints (e.g. knowledge agglomerations63,64,65).
Our results corroborate recent findings about the concentration of digital trade49. Nevertheless, trade in digital products encompasses a relatively narrow set of goods or services. Hence, it is still plausible that the observed differences in concentration arise not because of differences in these two forms of trade, but because we expect a smaller set of products to originate in a smaller set of countries. To test this hypothesis, we conduct two robustness checks in the Supplementary Note 6. First, we compare the concentration of trade in digital products with the concentration of trade in each EBOPS services section and in each Harmonized System (HS) goods section (each involving a few dozen products). Second, we perform a simulation where we randomly select physical goods to match the total trade value of the ones available in our dataset of digital products. In both cases, we find that digital products exhibit a substantially higher concentration of exports, indicating that this is not a consequence of simply considering a smaller number of sectors.
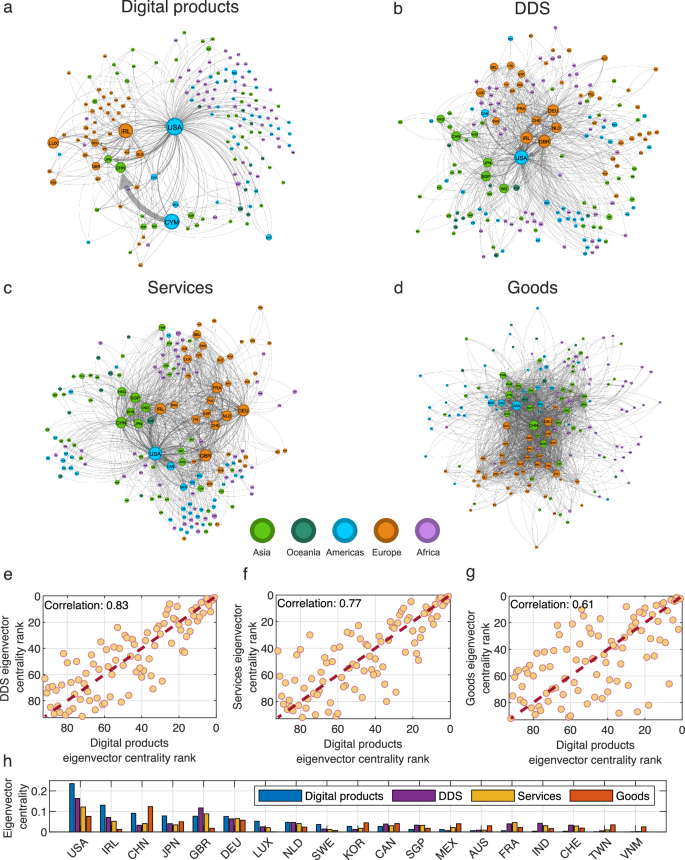
The spatial concentration patterns provide, at best, an incomplete picture of the networks of global trade. So next, we compare digital products, DDS, services, and physical goods using network visualizations (Fig. 5a–d). We formalize the position of a country in each of these networks using eigenvector centrality66,67,68, a measure of a node’s importance in a network. We use the eigenvector rank correlations between the countries in these four networks to study their similarities (Fig. 5e–g, using only the countries with non-zero digital product trade network centrality). The digital products trade network most closely resembles the DDS network, followed by the services network69. Indeed, all these networks are centered primarily on the US, with the difference being that in the digital products network tax havens such as Ireland and Luxembourg play a more central role (Fig. 5h). The physical goods trade network70,71, in contrast, is centered around three regional hubs: The United States, Germany, and China, with China being the most central node in this network.
a–d show country-to-country networks of trade in digital products (a), digitally delivered services (b), services(c), and goods (d) in 2021. For each country, we show the top import and export destination. We also highlight all bilateral trade flows with a volume above USD 1B. e–g Scatter charts comparing the countries’ eigenvector centrality rank in the digital products trade network to the centralities in the digitally delivered services (e), services (f), and goods (g) networks. We use data only on countries with non-zero digital product trade eigenvector centrality. h Eigenvector centralities for the top 10 countries in terms of eigenvector centralities in all four networks. We exclude countries with only available export data from the eigenvector centrality calculations.
Implications of trade in digital products: trade balances, decoupling, and complexity
Having explored the spatial and temporal dynamics of trade in digital products we now turn into their implications. Here, we explore three key implications: trade balances12,13,14,15,16,17, the decoupling of greenhouse gas emissions from economic growth20,21,22,23,72, and estimates of economic complexity29,30,31,32,33.
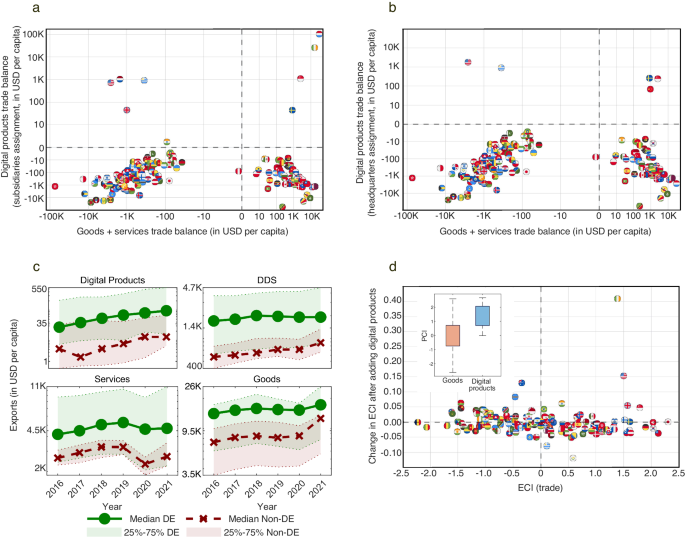
First, we use our estimates to understand how digital products trade affects trade balances. Figure 6a, b present comparisons between trade balances in goods and services (x-axis) and trade balance in digital products based on subsidiaries (6a) and headquarters (6b). The latter of these two captures information about GATS Mode 3 trade. In both figures we can clearly observe four quadrants. On the top right we have countries with a positive balance of trade in both, goods and services, and in digital products. Using subsidiaries (6a), these are Sweden, Ireland, Luxembourg, and Singapore. Using headquarter assignment (6b), we get Sweden, China, and Singapore, indicating that Ireland and Luxembourg’s positive trade balance may be due to them acting as passthrough countries for the GATS Mode 3 trade of other countries, such as Sweden and the United States. On the bottom right, we have economies with a trade surplus in goods and services and a trade deficit in digital products. These are natural resource exporters, such as Saudi Arabia, and manufacturing hubs, such as Mexico. The top left quadrant are countries with trade deficits in goods and services and trade surpluses in digital products: the United States, India, Uruguay, the Netherlands, and the United Kingdom, in the case of subsidiary assignment (6a), and the United States and Uruguay when using the headquarters assignment (6b). Finally, the bottom left quadrant is populated by countries with a trade deficit in both, goods and services and digital products. This quadrant is mainly populated by developing economies, such as Cameroon and Paraguay, but also includes some advanced economies, such as Austria. We note that trade in goods and services was anomalous in 2021 due to the COVID-19 pandemic, meaning that countries may have shifted into different quadrants in more recent years.
a Total trade balance (goods + services) vs digital product trade balance (USD per capita) in 2021 using the subsidiary assignment for digital products trade. b Same as a, only using the headquarters assignment for digital products trade. c Average digital product, DDS, services, and goods exports per capita between 2016 and 2021 for high income economies depending on whether they decoupled growth from emissions or not (DE – decoupled, Non-DE – not decoupled). We highlight the regions enclosed by the 25th and 75th percentiles. d Change in economic complexity index estimates after incorporating trade in digital products to data on physical trade. Inset shows boxplots for the PCI of digital products and physical products in 2021.
Next, we explore the correlation between trade in digital products and economic decoupling. This is related to the idea of the twin transition: the notion that economies can transition to lower emissions when digitizing20,21,22,23,24. We explore the twin transition by studying the relationship between decoupling of growth and emissions for a restricted sample containing only high-income economies with a population of above 1.5 million in 2021 (decoupling means positive GDP per capita growth and negative emissions per capita change, see Supplementary Note 7.1. for more details about our working definition). We use high-income countries as defined by the World Bank (GDP per capita above USD 13 205), to reduce potential endogeneity issues that may arise since high-income economies are more likely to both, decouple and trade more. In Supplementary Note 7.2., we show results for the full dataset.
We start by dividing countries into those that have and have not decoupled growth from emissions between 2016 and 2019, using production emission estimates from the Global Carbon Budget73 (in Supplementary Note 7.3. we repeat this exercise using consumption emissions). We then calculate the digital product, DDS, services, and physical exports trends for these two groups (the 25th percentile, median, and the 75th percentile). We find that decoupled high-income economies tend to have larger digital product export sectors compared to non-decoupled economies (Fig. 6c). The 25th percentile of the decoupled economies is of similar size to the median of the non-decoupled. Similar results hold for DDS, whereas for services and goods, we find that the 25th percentile of the decoupled economies is below the median of the non-decoupled. These descriptive results suggest that decoupling emissions from growth might be related with trade in digital products and that digitization and sustainable development could indeed be a correlated phenomenon (see discussion for possible channels)24.
Finally, we use our dataset to correct estimates of economic complexity. These are measures of the knowledge intensity of economic structures that are used frequently in economic development studies because of their ability to explain international variations in economic growth, inequality, and emissions29,30,31,32. The idea is that economies engaged in more sophisticated activities can pay higher wages, produce more output per unit of emissions27,47, and distribute their income more evenly74. While there has been progress in the development of multidimensional approaches to economic complexity32, as of today, the most widely used metrics rely on physical exports data, and thus, miss key information about digital activities.
We revise estimates of economic complexity by combining our digital product exports estimates by sector with physical export data using the HS4 product categorization (1200+ categories). We focus on goods data rather than DDS or services (which would be a better comparator in practice) because economic complexity calculations require highly disaggregate data which is available for the trade of goods and not for the trade of services. We use this data to estimate the Economic Complexity Index (ECI) and the Product Complexity Index (PCI) of each sector and economy for 2021 (the ECI of a country is the average PCI of its exports. By definition, both ECI and PCI have a mean of 0 and a standard deviation of 1, for more details see Supplementary Note 8.1.)29,30,31. Figure 6d shows that adding digital product exports data reduces the economic complexity estimates of some manufacturing hubs such as Mexico and Slovakia, and increases the complexity of economies involved in the exports of digital products, such as the US, Ireland, and Australia. These changes in complexity are explained by the fact that digital sectors tend to be high in sophistication. The inset of Fig. 6 d compares the PCIs of the 31 digital sectors with that of physical products, showing that digital sectors are—on average—high complexity compared to the ensemble of physical goods. The most complex digital sectors are Digital Advertising and eBooks, whereas the least complex is Online Food Ordering (see Supplementary Fig. 15 for the digital product complexity rankings).
We also test the ability of the ECI corrected for trade in digital products to explain economic growth and emission intensities (GHG per unit of GDP, see Supplementary Note 8.3.). Despite having a relatively short time series data, we find that the digital exports corrected ECI has similar performance at explaining future economic growth (Supplementary Table 4) and emission intensity (Supplementary Table 5) than ECI calculated using only physical trade data.
Estimating digital product trade through corporate revenue data #Estimating #digital #product #trade #corporate #revenue #data
Source Link: https://www.nature.com/articles/s41467-024-49141-z
Estimating digital product trade through corporate revenue data:
Estimating trade in digital productsWe construct a dataset of trade in digital products by combining…

