
Luis Alvarez/DigitalVision via Getty Images
The Employment Situation Report (ESR), corresponding to labor market activity during the month of June 2024, was published by the BLS on Friday, July 5, 2024, at 8:30 AM EST. This report makes available an extraordinary amount of important labor market data derived from two separate surveys: The Establishment Survey and the Household Survey.
In this article, we will walk readers through the most important employment statistics derived from both surveys. However, we will be providing a deep breakdown of the Establishment Survey. We will also discuss the likely implications of the report for bond and equity markets.
According to the BLS, the Nonfarm Payrolls (“NFP”) in June came in at 158,638 thousand payrolls and expanded by 206 thousand (0.13%)— surprising to the upside compared to the median forecast of professional economists, which expected 191 thousand change in NFP.
The forecasted 3-month annualized change of NFP was +1.60% growth rate. However, reported data (including the figures for the most recent month and revisions to prior months) indicate that NFP grew at a 3-month annualized rate of 1.35%, a rate of change, which ranks in the 32nd percentile historically.
The question now is: Based on a thorough analysis of the employment data, and the initial market reactions to it, should investors make any adjustments to their economic forecasts, and/or to their investment strategies?
The right answer is never an obvious one. Success in investing largely depends on finding difficult-to-obtain information and/or insights that supply an informational and/or analytical edge. This requires both diligence and skill. Our method, focused on five key questions, helps us generate an edge from analyses of just-released economic reports:
Was there any surprise?
What caused the surprise?
Did the surprise alter the macroeconomic outlook?
Is anything in this report being misunderstood or overlooked?
Has the initial market reaction given rise to any actionable opportunities?
In this article, these questions will be addressed as we walk readers through a four-step process. First, we will perform a comprehensive analysis of the just-released report. Second, we will update macroeconomic forecasts, based on this analysis. Third, we will adjust our investment assessments of major asset classes. Finally, we will deliver actionable insights that will enable readers to capitalize on our analysis.
Headline Data
We begin our examination with summary data and analytics, which we highlight in Figure 1. We recommend that readers pay particular attention to the percent rank of Month-on-Month (MoM) growth, MoM acceleration, and the surprises relative to forecasts.
Figure 1: Change, Acceleration, Expectations, and Surprise
Employment Situation Report Summary Data (BLS & Investor Acumen)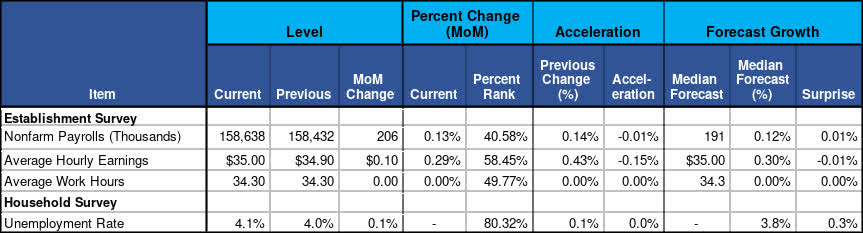
NFP expanded 206K total jobs this past month. This change was below the historical median, ranking in the 41st percentile. This month’s change represented a -0.01% (12K) deceleration from the prior month.
Figure 1 provides similar analysis for Average Hourly Earnings and Average Hours Worked (Weekly).
A Deep Dive Into the Establishment Survey
This section of our report will be devoted to analysis of data derived from the Establishment Survey. The first section tracks the rates of change of nonfarm payrolls over several time frames, broken down by industry groups. The second section presents a decomposition analysis of the contributions of various industry groups to the overall MoM change in nonfarm payrolls.
Rates of Change and Momentum of NFP Components
In this section, we break down Nonfarm Payrolls Report by major industry groups, scrutinizing their annualized growth rates over various time frames (1m, 3m and 12m). The purpose of this analysis is two-fold. Our first purpose is to identify which components of NFP are exhibiting rates of change that are greater or less than the overall aggregates. Our second purpose is to determine whether, and to what extent, the rates of change of the various components are accelerating or decelerating over various time frames. Nonfarm Payroll figures are displayed in thousands.
Figure 2: Annualized Growth Rates of Key Components
Annualized Growth of NFP (BLS & Investor Acumen)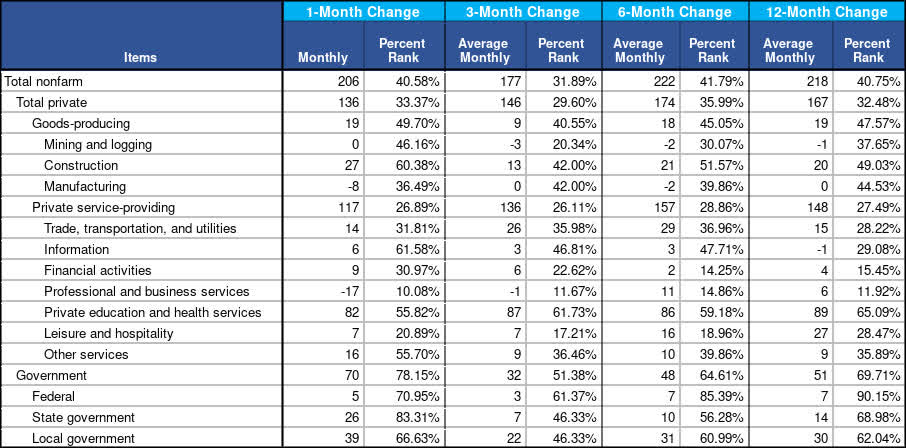
Strength and momentum of overall growth. As can be seen in Figure 3, overall NFP, on a 3-month average basis (177K), remained well below the historical median (32nd percentile). This represents a significant deceleration compared to the 6-month growth rate (42nd percentile).
Divergences in rates of change between categories. It is interesting to note the differences in the 3-month average change between Total Private and Government. In the Total Private sector, the 3-month average growth of payrolls (146K) was historically below average (30th percentile). The average growth (32K) in Government payrolls during the past 3-month period was historically above average (51st percentile). This is not a healthy pattern.
Attribution Analysis: Change and Acceleration of NFP Components
In this section, our analysis is focused on identifying the contributions of various industry groups to the MoM Change and MoM Acceleration of the aggregate Nonfarm Payrolls statistic. Nonfarm Payroll figures are displayed in thousands.
Figure 3: Contributions to Change and Acceleration Attributable to Major Components
Contribution of Components to NFP (BLS & Investor Acumen)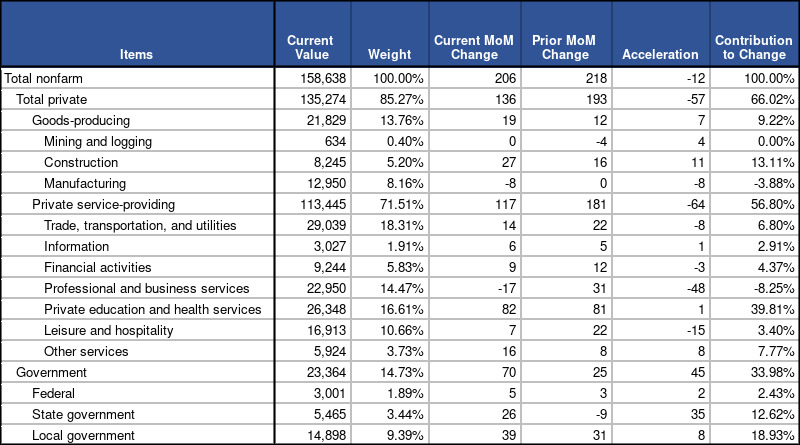
As can be seen in Figure 4, the MoM change in total NFP in June (206K) decelerated by -12K compared to the prior month (218K). This is attributable to a -57K contribution to deceleration from Total Private payrolls and a 45K contribution to acceleration from Government Payrolls.
Within the Private sector, Goods-producing payrolls accounted for 7K contribution to acceleration, while Private service-providing accounted for -64K contribution to deceleration.
Notably, Professional and business services contributed to the bulk of the deceleration, with a deceleration of -48K jobs in June.
US Economy Outlook: Implications of the Employment Data
In this section, we address the following question: Based on our comprehensive analysis of the just-released NFP data, what (if any) changes should we make to our macroeconomic forecasts and/or our overall outlook for the US economy?
Updates to US Economic Forecasts
Let’s begin with a brief review of forecasters’ expectations leading into this report. The median forecast of professional economists expected the BLS to report that Nonfarm Payrolls grew by 191K during the most recent month.
Assuming that this forecast had been entirely correct, and that there were no revisions to prior data, the 3-month annualized change of NFP would have been a +1.60% growth rate, ranking in the 39th percentile historically.
As it turns out, reported data (including the figures for the most recent month and revisions to prior months) indicate that NFP grew at a 3-month annualized rate of 1.35%, a rate of change which ranks in the 32nd percentile historically.
This means, predominantly due to revisions of prior data, that the actual 3-month rate of job growth was 7 percentile points lower than expected. However, this weakness is even more pronounced when we look at the far more important Private Payrolls, which ranked in the 29th percentile historically.
Update of Overall Outlook for the US Economy
Currently, the overall outlook for the US economy is dominated by whether the US economy will achieve a “soft-landing.” How does our thorough analysis of the just-released payroll data impact the analysis of this question?
The employment numbers suggest that the labor market is losing “altitude” (i.e., decelerating); monthly job growth has decelerated sharply in the past three months to a well-below average pace. Private payroll growth has been particularly weak. The unemployment rate is also significantly off the lows. Temporary help services, which is a leading indicator, contracted sharply last month and is behaving as it has before the last few recessions.
It remains to be seen if any “landing” will be soft or hard.
These relatively weak job numbers raise the probability of one or more rate cuts in the second half of 2024. Fed funds futures markets are now pricing in two rate cuts in 2024
Market Outlook
Our readers know that we have been bullish on long-term Treasury bonds and particularly TIPS, due to our expectations of a slowing economy. The employment data continue to support our outlook for this asset class.
The picture for equities is more mixed. On the one hand, lower long-term yields are generally positive for equities. Additionally, better prospects for rate cuts and a general easing of financial conditions provide a good environment for equity performance.
However, we have numerous concerns that make us cautious regarding equities. First, a slowing economy could portend slower earnings growth – at a time when expectations for earnings growth are spectacularly high. Second, the terrible market breadth discussed in this Seeking Alpha blog post is a sign not only of underlying technical weakness in the market, but of significant imbalances in the macroeconomy. These imbalances not only increase the risk of a recession; they increase the potential depth of a recession.
Concluding Thoughts
Our Investing Group team is generally of the view that the overall macroeconomic environment in the US and globally presents good reward-to-risks prospects for a very select group of equities. However, as indicated in this Seeking Alpha blog post regarding underappreciated risks emanating from the Middle East, we are also growing increasingly concerned about various risks in the second half of 2024 – particularly the risk of a major oil price shock. Indeed, we think that very unusual opportunities are going to emerge in the second half of 2024, starting sometime between June and August.
June 2024 Employment: Worrisome Weakness Opens Door To Rate Cuts #June #Employment #Worrisome #Weakness #Opens #Door #Rate #Cuts
Source Link: https://seekingalpha.com/article/4702586-june-2024-employment-worrisome-weakness-opens-door-to-rate-cuts
June 2024 Employment: Worrisome Weakness Opens Door To Rate Cuts:
Luis Alvarez/DigitalVision via Getty Images The Employment Situation Report (ESR), corresponding …
